One of the challenges I faced when starting to toy around with self-hosting and setting up infrastructure at home, was how to deal with the logs. It was pretty clear early on that I want to use docker containers for most things because of the ease of configuration and the reproducible environments. But also non-Docker infrastructure is producing logs. I wanted all of those logs in one place. At least until now every system is able to send its log output to a remote syslog server. So I was looking for a stack for collecting, processing and exploring those logs. There is a ton of options out there like the ELK stack, Graylog or the Grafana tools. Because it is my homelab and rebuilding something that doesn’t quite solve the problem, fit the rest of the architecture or is simply broken is part of the fun, none of the tech choices were made with a lot of consideration. Ultimately there is always the option to rebuild. But for the moment I am very happy with the outcome of this setup and due to that this post is born.
You can find the complete setup discribed here also on Github.
The Stack
The general idea is to use Vector for providing endpoints to send syslogs to and for transformations before writing to Loki. Loki is used for storing the logs and as query engine and finally we have Grafana for exploration and dashboarding. Docker logs are sent using the syslog logging driver. Other sources can easily be added by configuring them to send their syslogs to Vector, or by using other Vector source types (which I did not explore yet).
Docker
For Docker to write to our Vector syslog endpoint, we use the syslog logging driver with an external address configured. It is enough to add the following block to the services in the docker-compose file:
logging:
  driver: syslog
  options:
    syslog-address: "udp://<vector_ip:port>"
    tag: "<service>"
The tag can later be used to filter for specific containers. If required tag format and syslog format can be configured.
Vector
Vector is a data pipeline tool for observability data. It has a whole bunch of features, can do complex transformations and is quite fast. In this example we only use it to receive syslogs, parse them and then write them to Loki. Data enters the tool from sources and leaves it in sinks.
Source
For this purpose a single source of the syslog type is enough. In my real setup where multiple source systems write to Vector, I offer an endpoint per system on different ports to easily tell the streams apart.
sources:
  dockersyslog:
    type: syslog
    address: '0.0.0.0:5123'
    mode: udp
Transform
In this simple example no transformations are used. But if you for example have logs with IP addresses in them, transformations can be used to geotag them. You can also extract information that can then be used for labels in Loki.
Sink
Vector internally parses the syslog messages coming in to Vector events. As mentioned before, no transformations are applied and the events are written directly to Loki using a JSON encoding with the following config. While doing so we apply a label called docker. Within Loki those labels can be used to easily filter but also each unique combination of labels defines a stream that is stored on its own.
sinks:
  loki_dockersyslog:
    type: loki
    inputs:
      - dockersyslog
    encoding:
      codec: json
    endpoint: 'http://loki:3100'
    labels:
      logsource: docker
Loki
Loki is marketed a bit as being Prometheus for Logs. To me thats not especially helpful because I never used Prometheus. Maybe that is something for a future project. Right now my metrics are collected by telegraf and pushed into an InfluxDB instance and that works well enough to not touch it for now. As mentioned before, each combination of labels defines a stream that is stored and queried together. They can be queried using LogQL, which at least for me took a bit of getting used to and actually still does. When stuck, I ask some LLM thats currently available and sometimes that helps and at other times it just gets me stuck a bit more. LLMs, right?
Loki Config
In the linked Github Repo, a basic Loki config is provided. That should only be seen as a starting point, because how storage and chunks work is not quite intuitive and especially in a homelab setup where log volume is probably rather low, it might make sense to increase limits drastically as for example described here.
Grafana
Grafana is used for dashboarding and log exploration. Using the provisioning feature the Loki datasource is being preconfigured with the following snippet.
datasources:
  - name: Loki
    isDefault: true
    type: loki
    access: proxy
    url: http://loki:3100
    editable: true
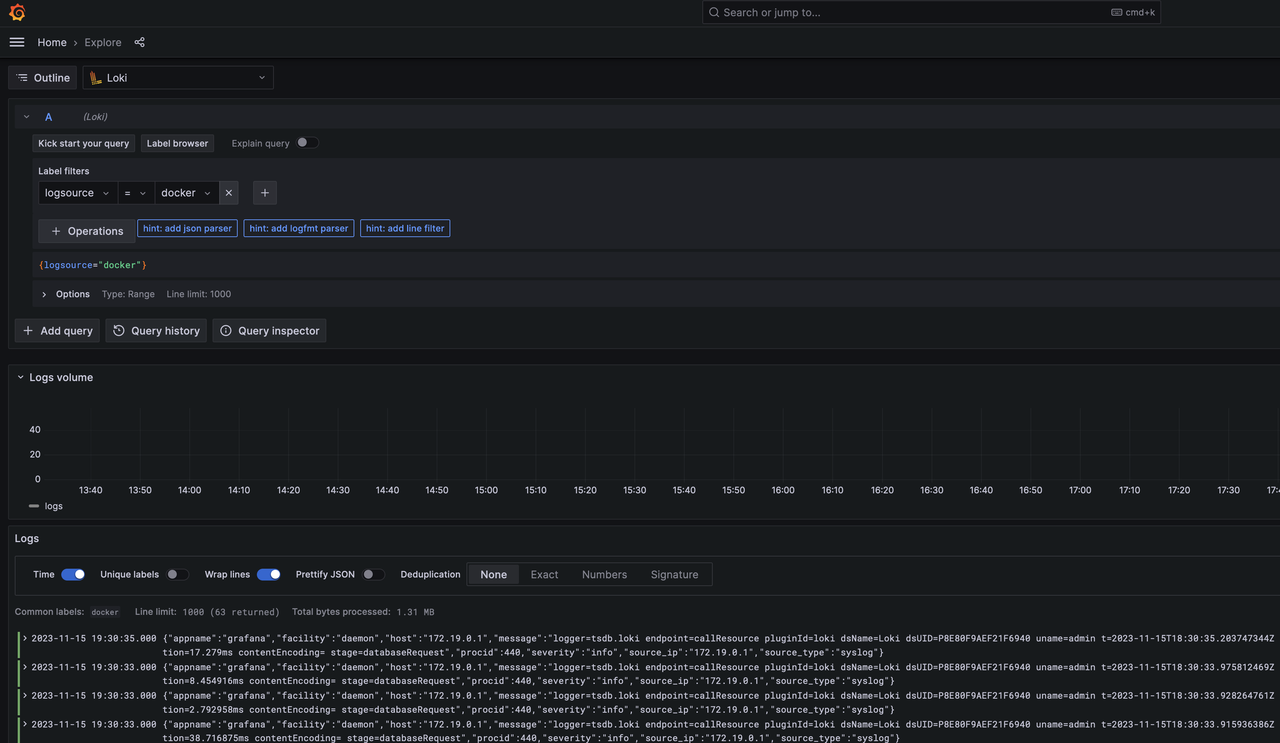
If everything goes according to plan, you can access grafana under localhost:3000 after a docker compose up within the cloned repo. The default credentials are admin:admin. If you open the menu, click on explore and select Loki as datasource and docker in the label browser, you should be able to see logs somewhat like this:

A good starting point for log exploration is the following query, that parses the JSON first, selects the message and then parses the logfmt of the actual Grafana log message.
{logsource="docker"} | json | line_format "{{.message}}" | logfmt
Happy exploring!